Real-Time Metrics
The first section of System > Monitoring provides real-time information about the XLServer appliance.
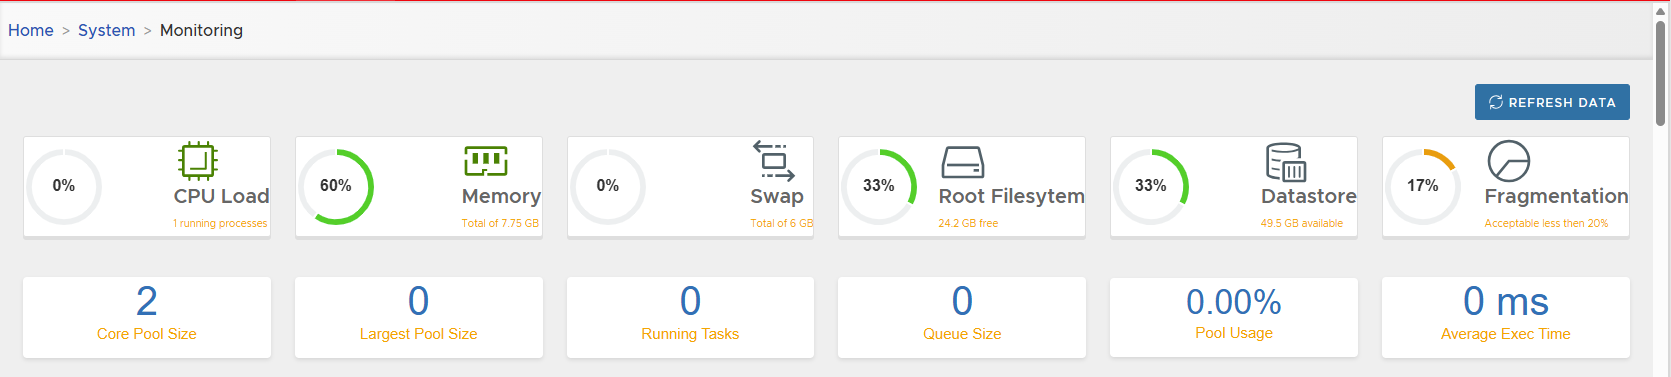
OS Metrics
These metrics give immediate visibility into the operating system status:
- CPU Usage – Current CPU consumption of the appliance.
- Memory & Swap Usage – Amount of memory in use and swap space utilization. High swap usage can indicate memory pressure.
- Root Filesystem Usage (
/) – Used vs available disk space on the system root partition. - Datastore Usage – Current used capacity of the ZFS datastore.
- Datastore Fragmentation – Fragmentation percentage, useful for anticipating performance degradation.
Job Executor Metrics
Job executor metrics provide insights into the internal job scheduling and execution engine:
- Core Pool Size – Maximum allowed concurrent jobs.
- Largest Pool Size – Highest number of threads created so far.
- Current Running Tasks – Number of tasks being executed.
- Total Tasks in Queue – Pending tasks waiting for execution.
- Executor Pool Usage (%) – Utilization of the job executor pool.
- Average Execution Time per Task – Performance indicator of task duration.
💡 Click on REFRESH DATA to update the real-time metrics view.